Index
1. Introduction2. Recipient
3. Check
4. Alert Trigger
5. Test your setup
1. Introduction
Welcome to the Check tutorial. In this guide, we will help you create and configure uptime monitoring for your website.
This tutorial will take ...less than 3 minutes to complete.
Prerequisites
To continue, you need to be logged in to your Netping account in order to access the Netping dashboard. If you haven't already done so, please register an account, login, and return to this tutorial.
2. Recipients
Before we begin setting up the monitoring itself, we need to create at least one recipient. A recipient is the endpoint that will receive alerts if your website goes down. Alerts can be sent to several recipients at the same time. A recipient can be a phone number (for SMS alerts), an email address, or any of the other types listed below.
| Recipient type | Description |
|---|---|
| SMS | Alerts sent as SMS-message. |
| Alerts sent as E-mail message. | |
| App | Alert sent as an App-notification to the netping app on your smartphone. |
| Slack | Alerts sent to your Slack.com channel. |
| List | A prioritized list of recipients to create an escalating alert scheme. E.g. If person A does not respond to the alert within 10 minutes contact person B. If person B does not solve the issue within 1 hour notify person C. Etc. |
| Schedule | Define a recurring weekly/monthly contact schedules, so the right person gets notified according to your organization and team. |
| Webhook | Configure Netping to contact a HTTP URL if your check goes down. |
Create a Recipient
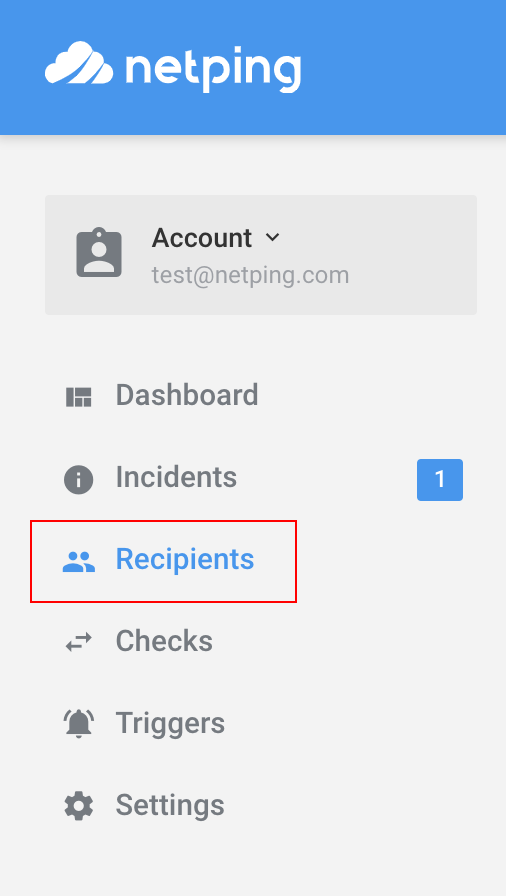
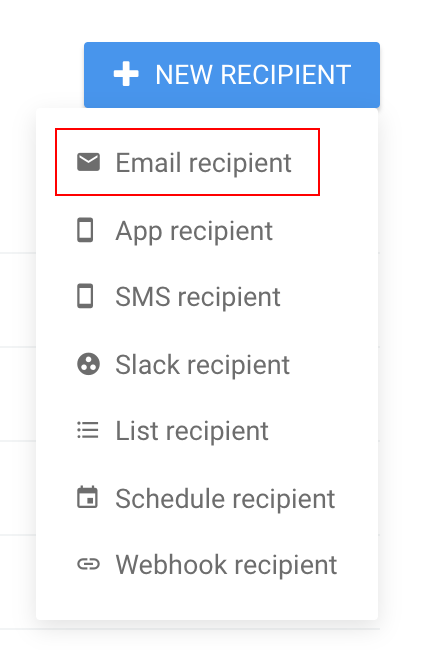
Next, we will create an email recipient. (You are welcome to deviate to any of the other types of recipients listed above.) To create an email recipient, click "Recipients" on the dashboard menu, then click the "New Recipient > Email Recipient" button. On the following page, type in a name and email address and then press Save. Feel free to create more than one recipient if needed.
3. Uptime Monitoring
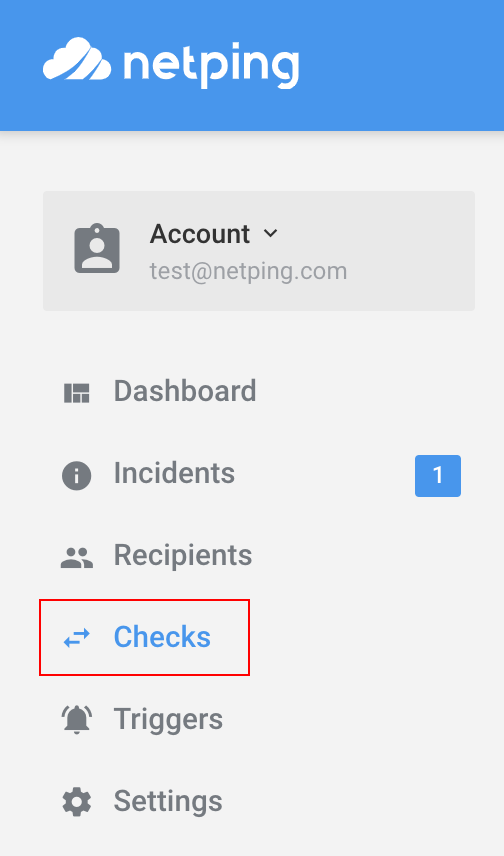
The next step is to create and configure the monitoring itself. The uptime monitoring function is what we call a Check. To begin, click "Checks" on the dashboard menu, then click the "New Check" button.
Type in the required information on the “Create Check” page and click Save. If needed, read the field descriptions below.
| Standard settings | Description |
|---|---|
| Name | A string to name this Check by. E.g. 'Mywebsite.com' or 'My Web Site'. |
| Check Interval | How often (in minutes) Netping should test the uptime of your website. If no special reason, select the lowest value available. |
| Check Location | Location to test your website From (what check node to use). Select one from the list. |
| URL | The URL of your website. E.g. 'http://www.mysite.com' |
| Create Response Trigger | Enable this toggle to automatically create a trigger to warn you if your site stops responding correctly. |
| Domain Expiry Trigger | Enable this toggle to automatically create a trigger to warn you if your domain name is close to expiry. |
| SSL Expiry Trigger | Enable this toggle to automatically create a trigger to warn you if your SSL certificate is close to expiry. |
| Advanced settings | Description |
| Method (optional) |
The HTTP method to be used when netping contacts your website URL. Either select GET or POST. |
| Post data (optional) |
Custom data to be sent with the HTTP request, if request method is set to POST |
| Username (optional) |
If the supplied URL is protected with HTTP authentication, authenticate with this username. |
| Password (optional) |
If the supplied URL is protected with HTTP authentication, authenticate with this password. |
| Request headers (optional) |
Custom data to be added to the HTTP request header. |
| Check for string (optional) |
This string must be returned in the response of your URL, or your service will be considered down. |
4. Alert Trigger
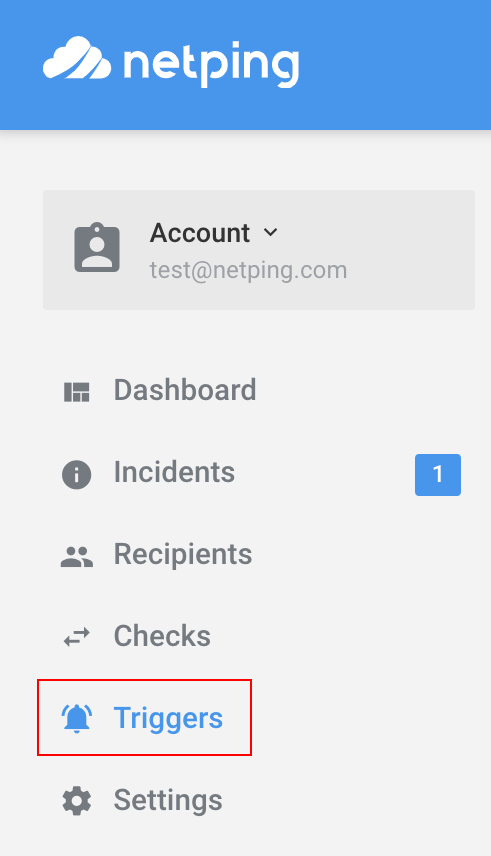
To get notified if problems arise with your service, you have to create an alert trigger. To create an alert trigger, click "Triggers" on the dashboard menu, then click the "New Trigger" button. If you enabled the Trigger Toggles in the last step, a few triggers have already been created for you. Feel free to edit them, or follow the Trigger creation below.
(select "Response Trigger")
Type in the requested information on the “Add Trigger” page and click Save. If needed, consult the field descriptions below.
| Field name | Description |
|---|---|
| Name | Add a descriptive name of this trigger. E.g. 'Mysite.com Responsetime Trigger' |
| Check | Select the Check you would like to create a trigger for (the name you choose in step 3). |
| Maximum Response Time | Select after how long responsetime (in milliseconds) your service should be considered down. |
| Minimum duration | Select if you would like the trigger to execute an alert as soon as the condition is met, or when the condition has persisted for some time. |
| Alert Recipient | Select one or more recipients that will receive the alert of the trigger executes. |
| Auto Resolve Incident | If this trigger executes, an Incident Log will be created. Select if you would like the incident to automatically be marked as Solved after x minutes of regained uptime. |
5. Test Your Setup
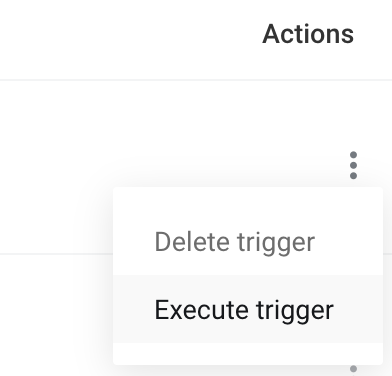
A good final step is to test the monitoring service after completion. Click “Triggers” on the dashboard menu, find your check trigger in the list and select "Execute Trigger” from the “Actions” dropdown menu. This simulates an outage and triggers an alarm without the need to disrupt any of your services.
In Summary
That’s all! In only a few minutes, we have learnt how to create, configure, and test the uptime, SSL and Domain Name monitoring for your website. Next, you might be interested in investigating one of our more advanced recipient types (e.g. priority lists, schedules, or webhook integration).
